

OpenStreetMap XYZ — central London#
Load a small slippy-map window, compute it, and plot the mosaic.
Uses XYZConfig.for_openstreetmap (identifiable User-Agent, max 2 in-flight, ~2 req/s). Include © OpenStreetMap contributors when displaying the imagery.
Note
OSM raster tiles are often palette PNGs, so the mosaic may be single-band (grayscale) today. For a full-colour RGB XYZ example see NASA GIBS XYZ — Blue Marble.
Code#
from tilearray import XYZConfig, create_array
from tilearray.types import CRS, Format

config = XYZConfig.for_openstreetmap(
    zoom=16,
    output_format=Format.PNG,
    chunk_size=(256, 256),
)

bbox = (-0.005, 51.495, 0.005, 51.505)  # ~central London
da = create_array(config, bbox, CRS.EPSG_4326, compute=True)
print(da.shape, da.dims, da.attrs["service_type"])
Result#
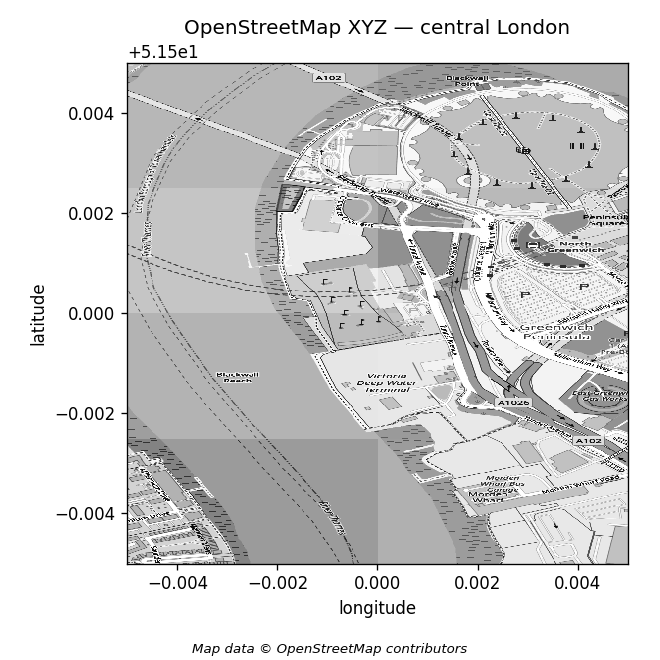
Map data © OpenStreetMap contributors.
Example shape for this window: about (1024, 512) (tile alignment can change that). Stay within OSMF tile policy — prefer the preset; do not raise concurrency past its caps.